For those of us – from aging baby boomers to generation Z – struggling with the question of how to move into the future and hold on to what we love about the past, this brief article offers some insight into the newest technology that will very soon impact all aspects of life.
The arrival of augmented reality (AR) seems inevitable ever since the launch of Google Glass in 2013. Since then, developers have been racing to deliver wearable devices with powers originally classified as science fiction. These capabilities include augmenting reality with your own physical world, projecting high resolution 3D images, and manipulating those images with your hands.
1. What is Augmented Reality?
Augmented Reality (AR) is the integration of digital information with the user’s environment in real time. Think Pokemon Go and Snapchap. In contrast, Virtual Reality (VR) – which has been around for some time – creates a totally artificial environment.
2. AR will arrive soon.
Tech futurists Scoble and Israel (2017) predict that more people will be using head mounted displays than hand held devices (smart phones) by 2025.
Source: Microsoft Hololens
If this transformation seems impossibly fast, keep in mind that two of the top “revolutionary” ideas of TechCrunch 2006 were the BlackBerry Pearl and the iPod Shuffle – two devices that are have been mostly forgotten in less than a decade. Computer scientists have a theory that predicts this change. The idea, introduced in 1965, that computer power doubles every two years at the same cost is known as Moore’s Law.
3. Is this a big deal?
According to Touchstone Research, AR is poised to swallow personal computing as we know it in the near future. By their count, over 40 AR headset and glasses products are already on the market or in the advanced stages of development. The race includes established companies like Microsoft, Google, and Apple, in addition to dozens of well-funded start-ups. Estimates of the total market size of the AR business by 2025 range from $80 and $162 billion. By comparison, the current global market size for television sets is roughly $80 billion.
4. Imagine the Possibilities!
AR promises to be a tool that provides a quantum leap in psychology education and clinical applications. Here are a few examples:
Source: HoloHear App for Microsoft HoloLens
AR for the Deaf: HoloHear is a HoloLens application that translates speech into sign language. When deaf people run the app, they see an avatar using sign language as well as subtitles.
AR for Autism: AR systems are now being used to encourage autistic children toward more imaginative play. Autism Speaks has funded a project to teach autistic teens about social skills in job interview settings and meetings with new people.
Other applications include an AR treatment for phantom limb pain, overlays for surgeries, and post-stroke hand rehabilitation. The fact that the user can actually see his own hands and the real world can help in exposure therapies for several types of psychological problems, such as spider and cock-roach phobias.
We are only at the tip of the iceberg with this new technology.
References
Scoble, R. & Israel, S. (2017). The fourth transformation: How augmented reality and artificial intelligence change everything. Patrick Brewster Press.
Kevin Bennett, Ph.D., is a social-personality psychologist, Assistant Teaching Professor, and Director of the Personality and Human Performance Lab (PHPL) at The Pennsylvania State University, Beaver Campus.
≈ Comments Off on Gamers Have an Advantage in Learning
People who play video games for more than 15 hours per week performed better in learning tasks and showed increased activity in brain areas associated with memory than non-gamers, a new study reports.
Neuropsychologists of the Ruhr-Universität Bochum let video gamers compete against non-gamers in a learning competition. During the test, the video gamers performed significantly better and showed an increased brain activity in the brain areas that are relevant for learning. Prof Dr Boris Suchan, Sabrina Schenk and Robert Lech report their findings in the journal Behavioural Brain Research.
The weather prediction task
The research team studied 17 volunteers who – according to their own statement – played action-based games on the computer or a console for more than 15 hours a week. The control group consisted of 17 volunteers who didn’t play video games on a regular basis. Both teams did the so-called weather prediction task, a well-established test to investigate the learning of probabilities. The researchers simultaneously recorded the brain activity of the participants via magnetic resonance imaging.
The participants were shown a combination of three cue cards with different symbols. They should estimate whether the card combination predicted sun or rain and got a feedback if their choice was right or wrong right away. The volunteers gradually learned, on the basis of the feedback, which card combination stands for which weather prediction. The combinations were thereby linked to higher or lower probabilities for sun and rain. After completing the task, the study participants filled out a questionnaire to sample their acquired knowledge about the cue card combinations.
Video gamers better with high uncertainties
The gamers were notably better in combining the cue cards with the weather predictions than the control group. They fared even better with cue card combinations that had a high uncertainty such as a combination that predicted 60 percent rain and 40 percent sunshine.
The research team studied 17 volunteers who – according to their own statement – played action-based games on the computer or a console for more than 15 hours a week. NeuroscienceNews.com image is in the public domain.
The analysis of the questionnaire revealed that the gamers had acquired more knowledge about the meaning of the card combinations than the control group. “Our study shows that gamers are better in analysing a situation quickly, to generate new knowledge and to categorise facts – especially in situations with high uncertainties,” says first author Sabrina Schenk.
This kind of learning is linked to an increased activity in the hippocampus, a brain region that plays a key role in learning and memory. “We think that playing video games trains certain brain regions like the hippocampus”, says Schenk. “That is not only important for young people, but also for older people; this is because changes in the hippocampus can lead to a decrease in memory performance. Maybe we can treat that with video games in the future.”
ABOUT THIS NEUROSCIENCE RESEARCH ARTICLE
Funding: Funded by German Research Foundation.
Source: Boris Suchan – RUB Image Source: NeuroscienceNews.com image is in the public domain. Original Research:Abstract for “Games people play: How video games improve probabilistic learning” by Schenk S, Lech RK, and Suchan B in Behavioral Brain Research. Published online August 24 2017 doi:10.1016/j.bbr.2017.08.027
Our visual attention is drawn to parts of a scene that have meaning, rather than to those that are salient or “stick out,” according to new research from the Center for Mind and Brain at the University of California, Davis. The findings, published Sept. 25 in the journal Nature Human Behavior, overturn the widely-held model of visual attention.
“A lot of people will have to rethink things,” said Professor John Henderson, who led the research. “The saliency hypothesis really is the dominant view.”
Our eyes we perceive a wide field of view in front of us, but we only focus our attention on a small part of this field. How do we decide where to direct our attention, without thinking about it?
The dominant theory in attention studies is “visual salience,” Henderson said. Salience means things that “stick out” from the background, like colorful berries on a background of leaves or a brightly lit object in a room.
Saliency is relatively easy to measure. You can map the amount of saliency in different areas of a picture by measuring relative contrast or brightness, for example.
Henderson called this the “magpie theory” our attention is drawn to bright and shiny objects.
“It becomes obvious, though, that it can’t be right,” he said, otherwise we would constantly be distracted.
Making a Map of Meaning
Henderson and postdoctoral researcher Taylor Hayes set out to test whether attention is guided instead by how “meaningful” we find an area within our view. They first had to construct “meaning maps” of test scenes, where different parts of the scene had different levels of meaning to an observer.
To make their meaning map, Henderson and Hayes took images of scenes, broke them up into overlapping circular tiles, and submitted the individual tiles to the online crowdsourcing service Mechanical Turk, asking users to rate the tiles for meaning.
Conventional thinking on visual attention is that our attention is automatically drawn to “salient” objects that stand out from the background. Researchers at the UC Davis Center for Mind and Brain mapped hundreds of images (examples far left) by eye tracking (center left), “meaning” (center right) and “salience” or outstanding features (far left). Statistical analysis shows that eyes are drawn to “meaningful” areas, not necessarily those that are most outstanding. NeuroscienceNews.com image is credited to John Henderson and Taylor Hayes, UC Davis.
By tallying the votes of Mechanical Turk users they were able to assign levels of meaning to different areas of an image and create a meaning map comparable to a saliency map of the same scene.
Next, they tracked the eye movements of volunteers as they looked at the scene. Those eyetracks gave them a map of what parts of the image attracted the most attention. This “attention map” was closer to the meaning map than the salience map, Henderson said.
In Search of Meaning
Henderson and Hayes don’t yet have firm data on what makes part of a scene meaningful, although they have some ideas. For example, a cluttered table or shelf attracted more attention than a highly salient splash of sunlight on a wall. With further work, they hope to develop a “taxonomy of meaning,” Henderson said.
Although the research is aimed at a fundamental understanding of how visual attention works, there could be some near-term applications, Henderson said, for example in developing automated visual systems that allow computers to scan security footage or to automatically identify or caption images online.
ABOUT THIS NEUROSCIENCE RESEARCH ARTICLE
Funding: The work was supported by the National Science Foundation.
Source: Andy Fell – UC Davis Image Source: NeuroscienceNews.com image is credited to John Henderson and Taylor Hayes, UC Davis. Original Research: Abstract for “Meaning-based guidance of attention in scenes as revealed by meaning maps” by John M. Henderson & Taylor R. Hayes in Nature Human Nature. Published online September 25 2017 doi:10.1038/s41562-017-0208-0
≈ Comments Off on Misinformation and biases infect social media, both intentionally and accidentally
Information on social media can be misleading because of biases in three places – the brain, society and algorithms. Scholars are developing ways to identify and display the effects of these biases.
People who share potential misinformation on Twitter (in purple) rarely get to see corrections or fact-checking (in orange). Shao et al., CC BY-ND
Explaining the tools developed at the Observatory on Social Media.
Our research has identified three types of bias that make the social media ecosystem vulnerable to both intentional and accidental misinformation. That is why our Observatory on Social Media at Indiana University is building tools to help people become aware of these biases and protect themselves from outside influences designed to exploit them.
Bias in the brain
Cognitive biases originate in the way the brain processes the information that every person encounters every day. The brain can deal with only a finite amount of information, and too many incoming stimuli can cause information overload. That in itself has serious implications for the quality of information on social media. We have found that steep competition for users’ limited attention means that some ideas go viral despite their low quality – even when people prefer to share high-quality content.
To avoid getting overwhelmed, the brain uses a number of tricks. These methods are usually effective, but may also become biases when applied in the wrong contexts.
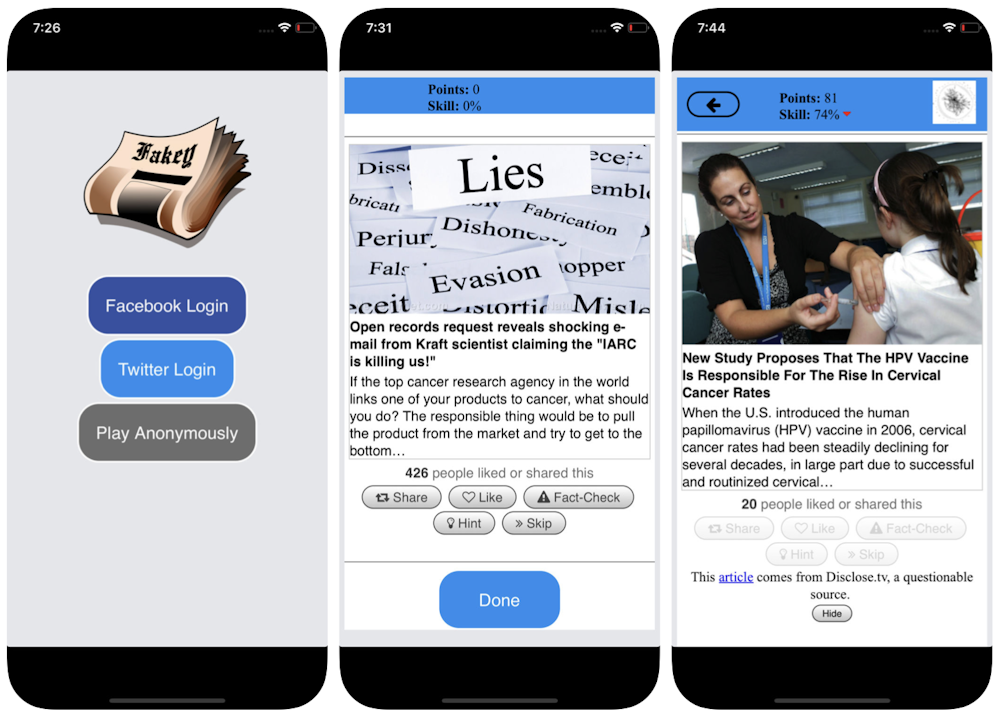
To counter this bias, and help people pay more attention to the source of a claim before sharing it, we developed Fakey, a mobile news literacy game (free on Android and iOS) simulating a typical social media news feed, with a mix of news articles from mainstream and low-credibility sources. Players get more points for sharing news from reliable sources and flagging suspicious content for fact-checking. In the process, they learn to recognize signals of source credibility, such as hyperpartisan claims and emotionally charged headlines.
Screenshots of the Fakey game.Mihai Avram and Filippo Menczer
Bias in society
Another source of bias comes from society. When people connect directly with their peers, the social biases that guide their selection of friends come to influence the information they see.
The tendency to evaluate information more favorably if it comes from within their own social circles creates “echo chambers” that are ripe for manipulation, either consciously or unintentionally. This helps explain why so many online conversations devolve into “us versus them” confrontations.
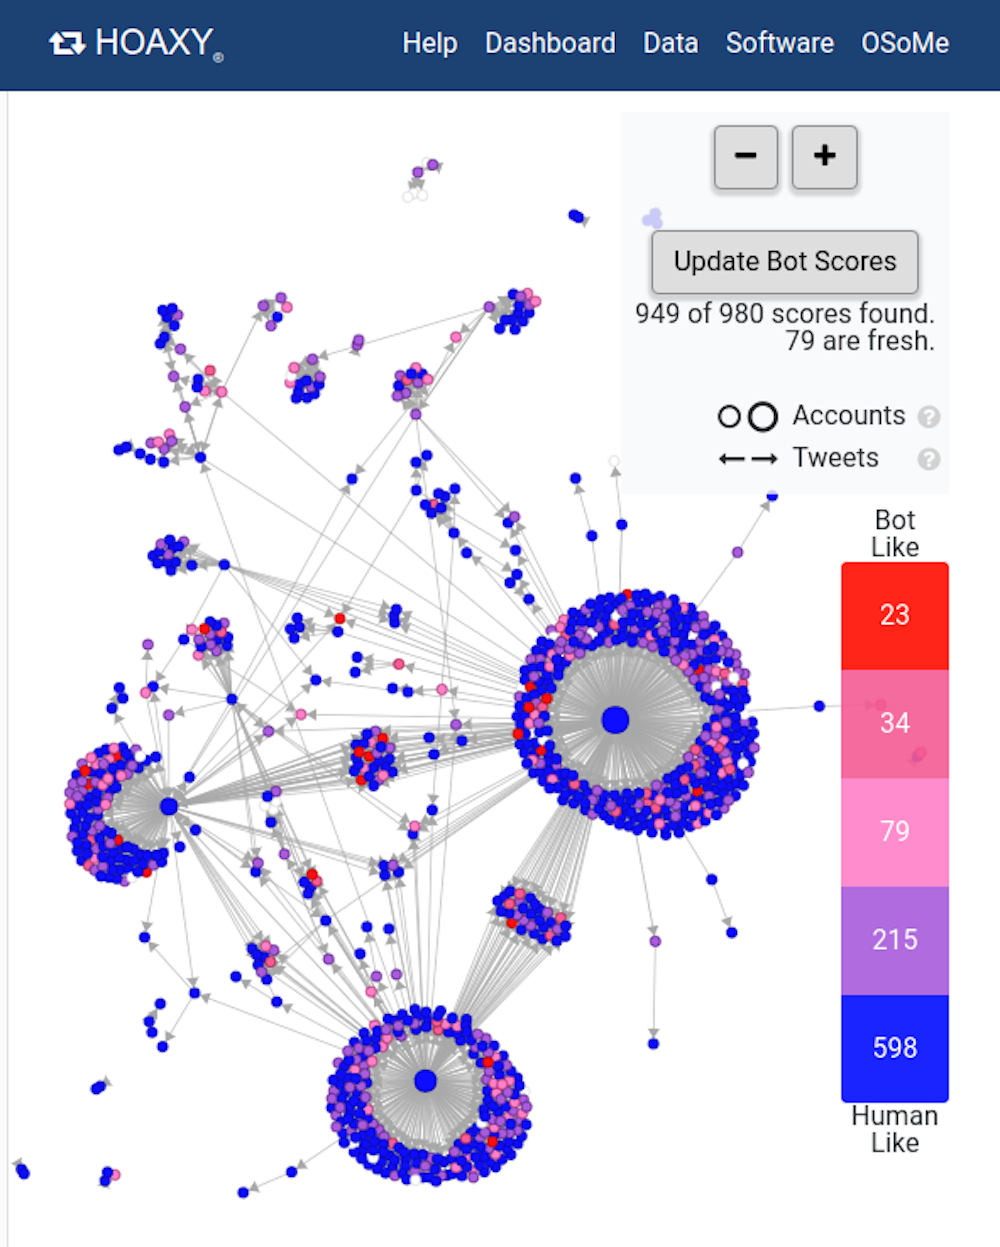
To study how the structure of online social networks makes users vulnerable to disinformation, we built Hoaxy, a system that tracks and visualizes the spread of content from low-credibility sources, and how it competes with fact-checking content. Our analysis of the data collected by Hoaxy during the 2016 U.S. presidential elections shows that Twitter accounts that shared misinformation were almost completely cut offfrom the corrections made by the fact-checkers.
When we drilled down on the misinformation-spreading accounts, we found a very dense core group of accounts retweeting each other almost exclusively – including several bots. The only times that fact-checking organizations were ever quoted or mentioned by the users in the misinformed group were when questioning their legitimacy or claiming the opposite of what they wrote.
A screenshot of a Hoaxy search shows how common bots – in red and dark pink – are spreading a false story on Twitter.Hoaxy
Bias in the machine
The third group of biases arises directly from the algorithms used to determine what people see online. Both social media platforms and search engines employ them. These personalization technologies are designed to select only the most engaging and relevant content for each individual user. But in doing so, it may end up reinforcing the cognitive and social biases of users, thus making them even more vulnerable to manipulation.
Also, if a user often clicks on Facebook links from a particular news source, Facebook will tend to show that person more of that site’s content. This so-called “filter bubble” effect may isolate people from diverse perspectives, strengthening confirmation bias.
Our own research shows that social media platforms expose users to a less diverse set of sources than do non-social media sites like Wikipedia. Because this is at the level of a whole platform, not of a single user, we call this the homogeneity bias.
Another important ingredient of social media is information that is trending on the platform, according to what is getting the most clicks. We call this popularity bias, because we have found that an algorithm designed to promote popular content may negatively affect the overall quality of information on the platform. This also feeds into existing cognitive bias, reinforcing what appears to be popular irrespective of its quality.
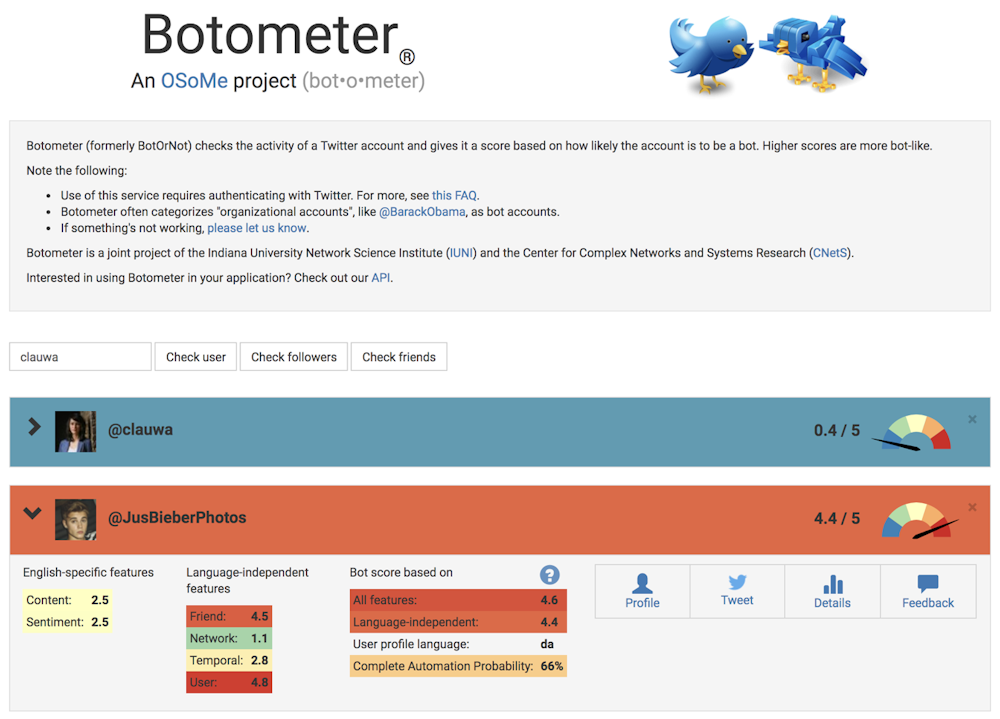
A screenshot of the Botometer website, showing one human and one bot account.Botometer
To study these manipulation strategies, we developed a tool to detect social bots called Botometer. Botometer uses machine learning to detect bot accounts, by inspecting thousands of different features of Twitter accounts, like the times of its posts, how often it tweets, and the accounts it follows and retweets. It is not perfect, but it has revealed that as many as 15 percent of Twitter accounts show signs of being bots.
Using Botometer in conjunction with Hoaxy, we analyzed the core of the misinformation network during the 2016 U.S. presidential campaign. We found many bots exploiting both the cognitive, confirmation and popularity biases of their victims and Twitter’s algorithmic biases.
These bots are able to construct filter bubbles around vulnerable users, feeding them false claims and misinformation. First, they can attract the attention of human users who support a particular candidate by tweeting that candidate’s hashtags or by mentioning and retweeting the person. Then the bots can amplify false claims smearing opponents by retweeting articles from low-credibility sources that match certain keywords. This activity also makes the algorithm highlight for other users false stories that are being shared widely.
Understanding complex vulnerabilities
Even as our research, and others’, shows how individuals, institutions and even entire societies can be manipulated on social media, there are many questions left to answer. It’s especially important to discover how these different biases interact with each other, potentially creating more complex vulnerabilities.
Tools like ours offer internet users more information about disinformation, and therefore some degree of protection from its harms. The solutions will not likely be only technological, though there will probably be some technical aspects to them. But they must take into account the cognitive and social aspects of the problem.